[cs_content][cs_section parallax=”false” separator_top_type=”none” separator_top_height=”50px” separator_top_angle_point=”50″ separator_bottom_type=”none” separator_bottom_height=”50px” separator_bottom_angle_point=”50″ style=”margin: 0px;padding: 45px 0px;”][cs_row inner_container=”true” marginless_columns=”false” style=”margin: 0px auto;padding: 0px;”][cs_column fade=”false” fade_animation=”in” fade_animation_offset=”45px” fade_duration=”750″ type=”1/1″ style=”padding: 0px;”][cs_text]In today’s webinar, we were joined by special guest presenter and senior analyst at Forrester, Richard Joyce. He helped us examine the rise of data-driven marketing and the relationship between quality of digital data and advertising ROI.
Did you know that, for a typical Fortune 1000 company, just a 10% increase in data accessibility will result in more than $65 million additional net income (Forrester, 2017)?[/cs_text][/cs_column][/cs_row][cs_row inner_container=”true” marginless_columns=”false” style=”margin: 0px auto;padding: 0px;”][cs_column fade=”false” fade_animation=”in” fade_animation_offset=”45px” fade_duration=”750″ type=”1/1″ style=”padding: 0px;”][x_blockquote cite=”” type=”left”]”For a typical Fortune 1000 company, just a 10% increase in data accessibility will result in more than $65 million additional net income.”[/x_blockquote][/cs_column][/cs_row][cs_row inner_container=”true” marginless_columns=”false” style=”margin: 0px auto;padding: 0px;”][cs_column fade=”false” fade_animation=”in” fade_animation_offset=”45px” fade_duration=”750″ type=”1/1″ style=”padding: 0px;”][cs_text]
That’s huge! Though with so much potential in data, it might come as a surprise to hear that 87% of marketers consider data to be their organizations’ most underutilized asset (Forrester, 2017). Many marketer’s know that data is important to reaching their company goals, and rank it as one of the top priorities in their organization, which has lead to increased investments in an effort to become more customer centric (Forrester Research Ad Technology (Data Management Platforms) Forecast, 2016 To 2021 (USl)).
But there’s one stumbling block as organizations dedicate more resources to become data-driven: Marketers rank managing data quality as their biggest challenge with marketing programs (Source: Forrester’s Business Technographics® Global Marketing Survey, 2016). It’s understandable, too. How can you align your initiatives and plan successful campaigns if you can’t accurately measure your ROI or if your data is just outright inconsistent?
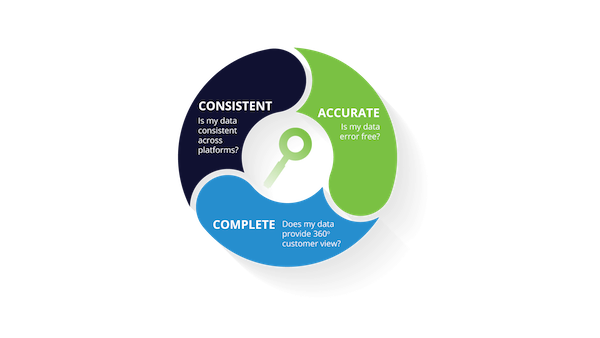
To expand on this concept, there are three components that make up high-quality data.
Without addressing each of these areas, you only have part of the picture. Applying this to other areas of your life, you wouldn’t condone a text book that was full of errors or rent a movie if you knew that you were only renting 70% of it. So why would you accept this with the data you use to make critical business decisions, day in and day out?
We dove into each area and opportunity for data improvement. Here’s a quick peek at what was covered and our favorite data point from each!
- Incomplete Deployment of Solutions: One day of missing data is roughly 3% of monthly conversions.
- Data Integration + Poor Data Supply Chain: CRM-powered ads are 47% more effective than traditional targeting.
- The Value of Measurement: They say a picture is worth a thousand words, so check out our basic model below that you can adapt to model your own analytics ROI.
[/cs_text][/cs_column][/cs_row][cs_row inner_container=”true” marginless_columns=”false” style=”margin: 0px auto;padding: 0px;”][cs_column fade=”false” fade_animation=”in” fade_animation_offset=”45px” fade_duration=”750″ type=”1/1″ style=”padding: 0px;”][x_blockquote cite=”” type=”left”]”CRM-powered ads are 47% more effective than traditional targeting.”[/x_blockquote][/cs_column][/cs_row][cs_row inner_container=”true” marginless_columns=”false” style=”margin: 0px auto;padding: 0px;”][cs_column fade=”false” fade_animation=”in” fade_animation_offset=”45px” fade_duration=”750″ type=”1/1″ style=”padding: 0px;”][cs_text]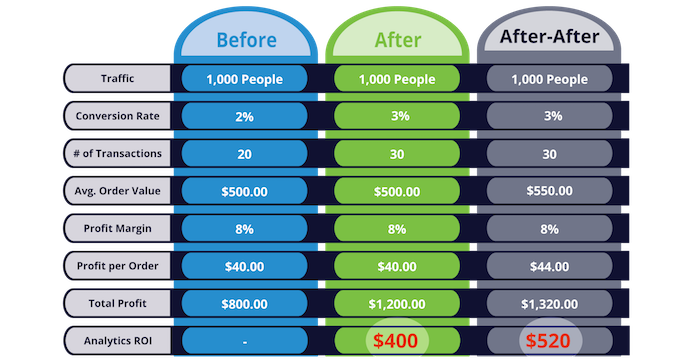
This webinar was chock-full of insights highlighting how organizations are investing resources in data quality, details on why quality data matters and the impact it can make on your budgets and the bottom line, as well as a walkthrough of the model above that will help you calculate the value of analytics and justify your budget. If you missed it, watch the recording below and email us at sayhello@taginspector.com with any of your data quality questions!
[/cs_text][/cs_column][/cs_row][/cs_section][/cs_content]
