Watch the video or read below to learn more about the data included in the Scan Report generated by the Scanner feature in Tag Inspector.
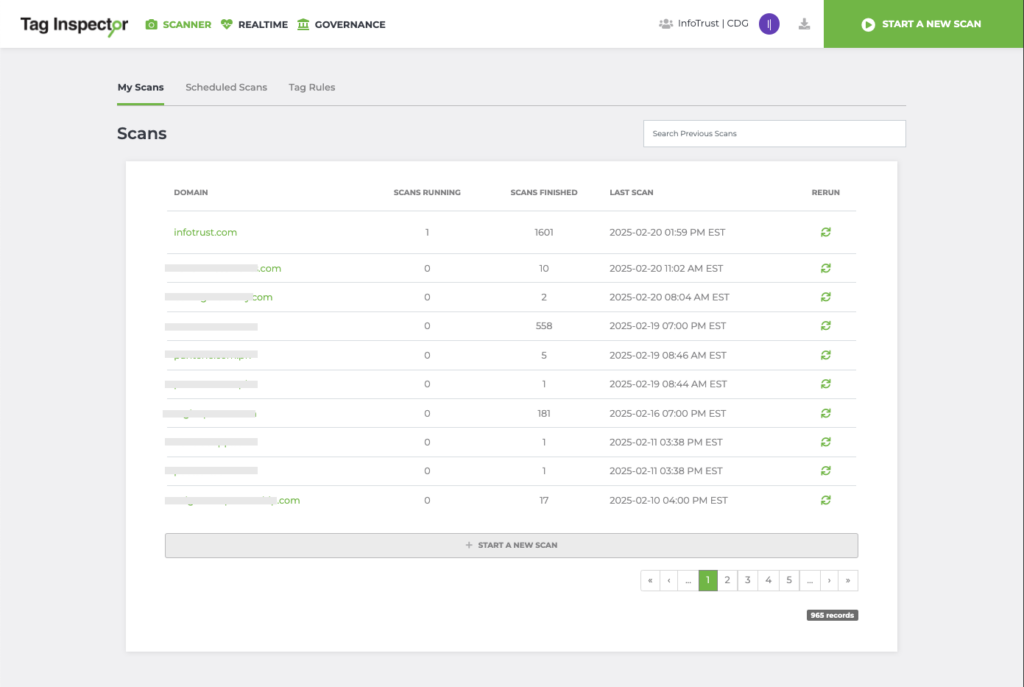
To access the completed scans, log in to Tag Inspector, select Scanner, and in “My Scans,” click the URL of the scan you would like to view. This will take you to the Scan Overview page.
Scan Overview
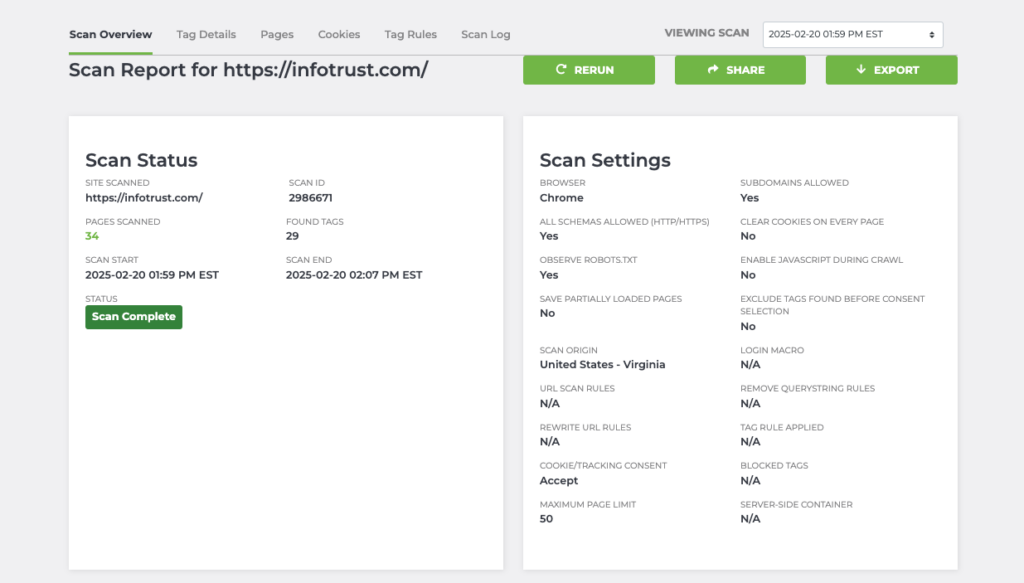
The Scan Overview will give you basic statistics about the scan such as the number of pages scanned, how many tags were found, the date and time when the scan started and was completed, as well as the options applied to the scan.
The dropdown box on the upper-right corner will allow you to switch between previous scan views.
From the report, you have the option to rerun the scan with the same settings, or tweak them as you like. You can also share a public view-only link of the scan result that can be accessed in incognito, and download a .csv export of the scan.
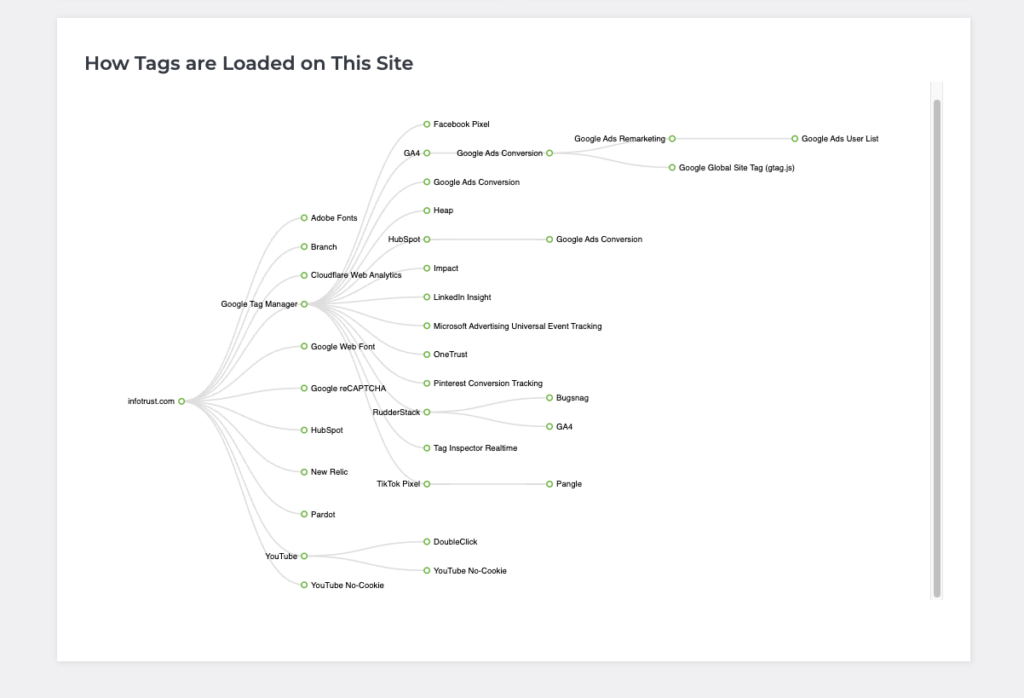
The tag hierarchy provides a visual representation of the tags found on your site and how they were loaded. Lines drawn to the URL are tags loaded directly from the website source code, while tags connecting to other tags are tags loaded either by a Tag Management System or rather what we call “piggybacking” from other tags.
This can look a bit more complex for other sites, where there could be multiple generations of tags firing.
Especially if you got more pages scanned, note that this chart may not display all of your tags, as it only shows tags that are loading at least 1 percent from your site.
Tag Details
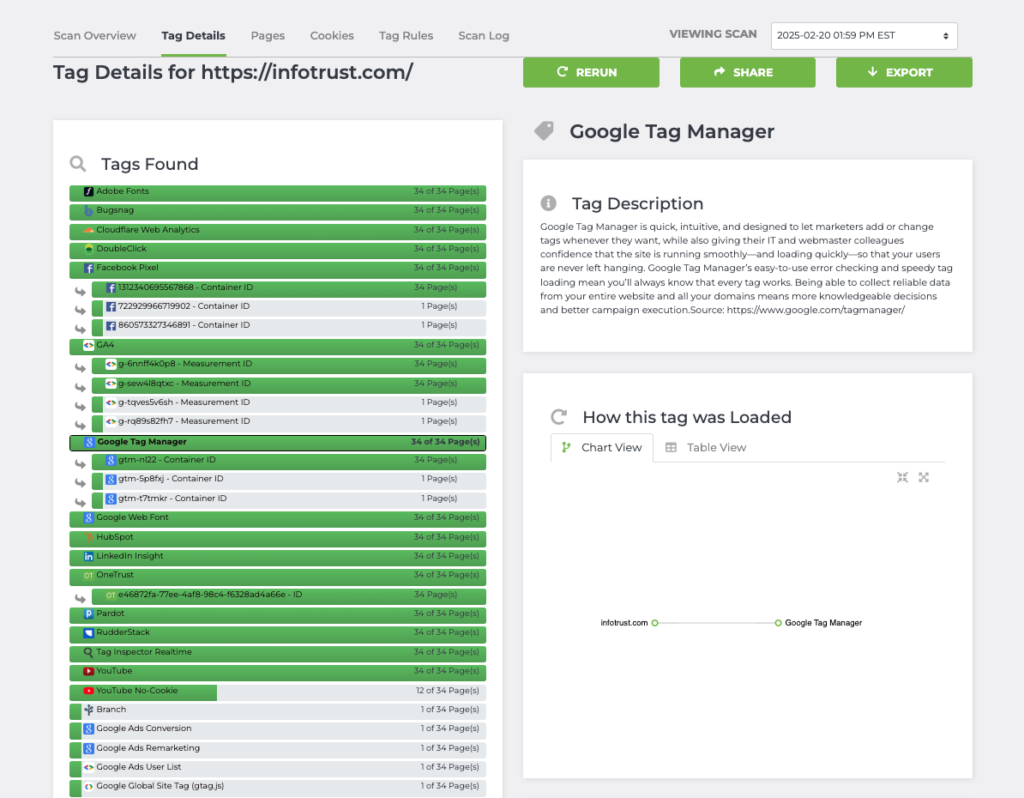
Tag Details provides a list of all the tags detected by Tag Inspector Scanner and indicates the number of pages it has been found out of all the pages scanned. Selecting a tag in this list will display further information about the tag, including:
- Tag description
- Snippet (tag hierarchy) of how this tag was loaded on your site – Chart view and table view
Note: It is recommended to look into the table view for a comprehensive list of Stacktraces, along with specific network requests detected on each URL the tag was found on. These are the data you can use to manually verify if the tag is really firing on your site. - Any parameters set by the tag* (best used for analytics purposes)
- All pages containing the tag*
- All pages missing the tag*
- Any cookies set by the tag*
(*) – Export is available
Tag Inspector works on click for more details model (click green texts for more info).
Pages
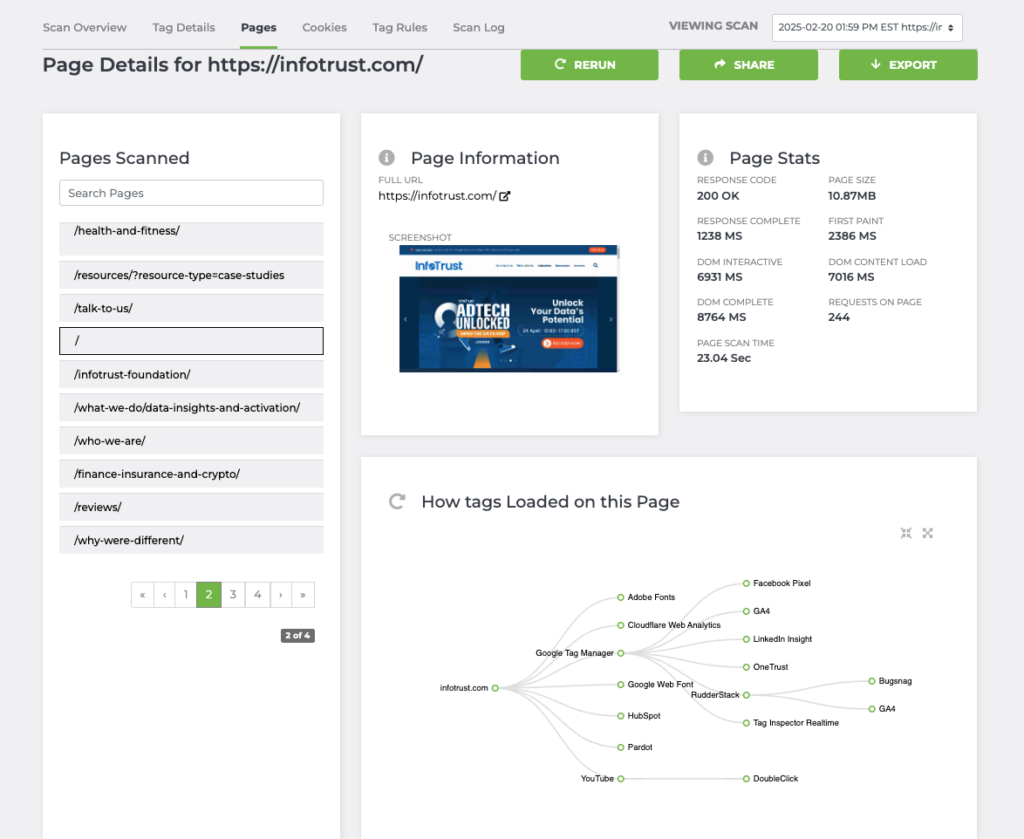
The Pages tab lists all the pages crawled by the Scanner. Selecting a page from the left will provide a full link and a screenshot, as well as the corresponding load times of that page. You may encounter a different response code for a page, like 404 if it is broken, or a 403 if forbidden.
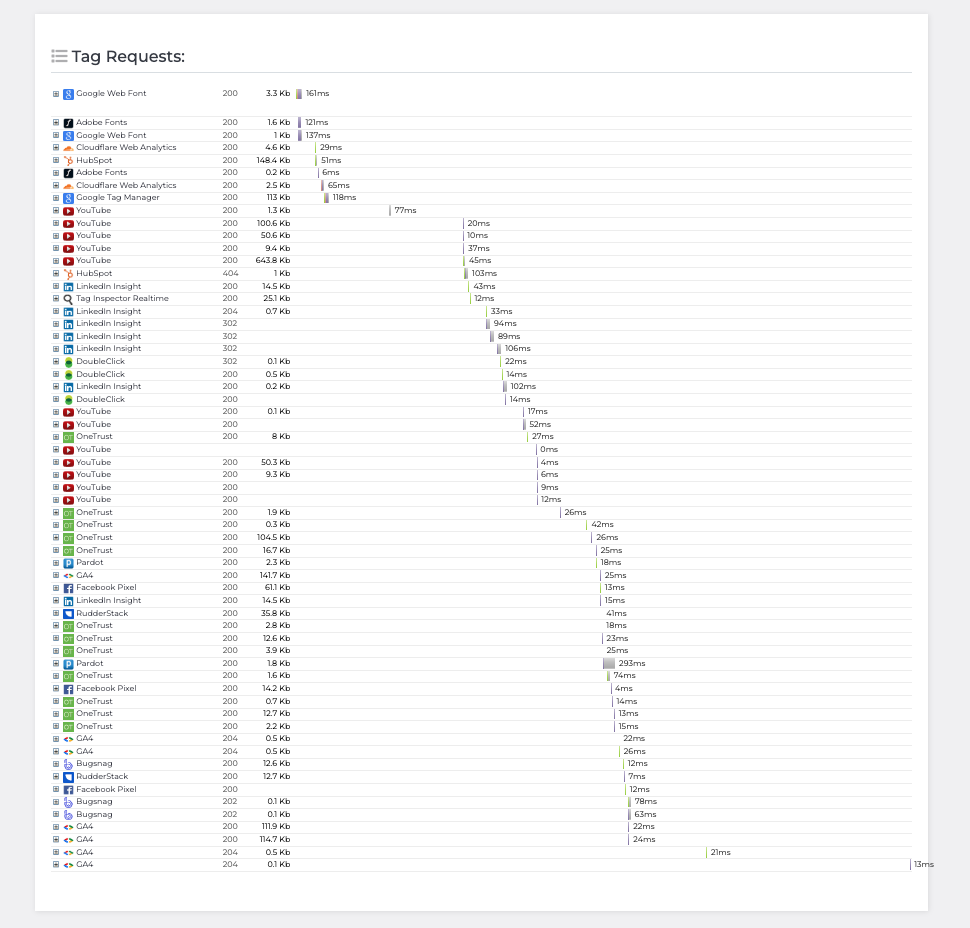
A tag hierarchy within that page is displayed and a waterfall chart will present the sequence of all the tags that fired and the request time for each on the page. You may also expand a tag for request information.
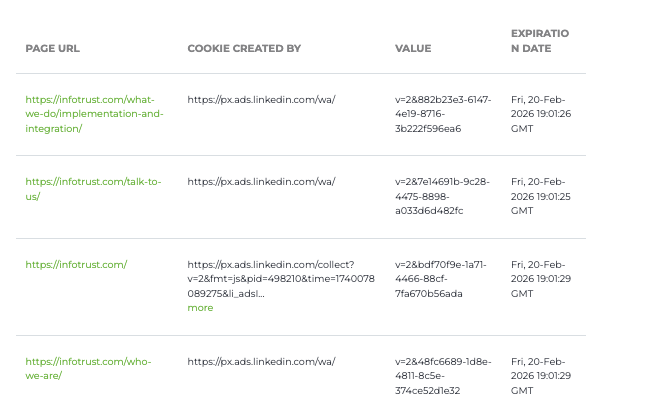
Cookies
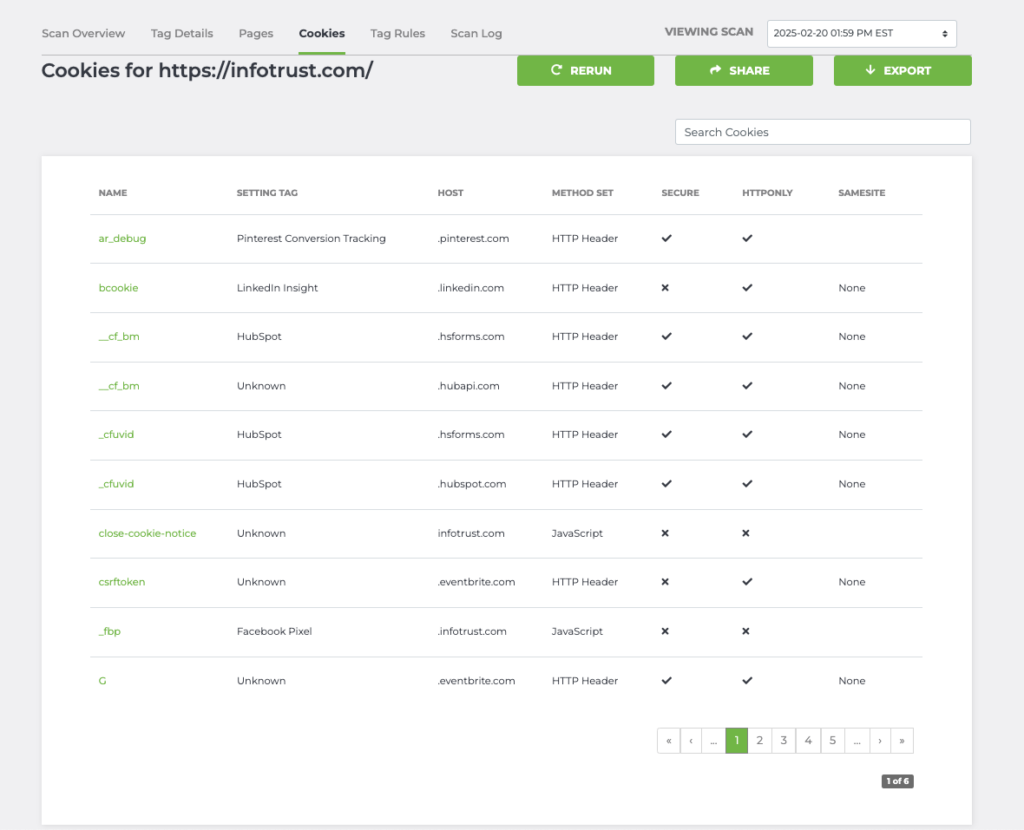
The Cookies tab provides all the cookies set by your site. Clicking on a cookie will give you a list of pages containing the cookie.