Reading the Tag Inspector Tag Stack Trace

Reading the Tag Inspector Tag Stack Trace
Estimated Reading Time: 7 minutes

Introduction

As folks may or may not know, Tag Inspector recently celebrated its 10th year anniversary!

Indeed, from its humble beginnings, Tag Inspector has certainly come a long way. It’s been a decade of inspecting tags and providing visibility into tag architectures for site portfolios of some of the biggest brands in the known universe.

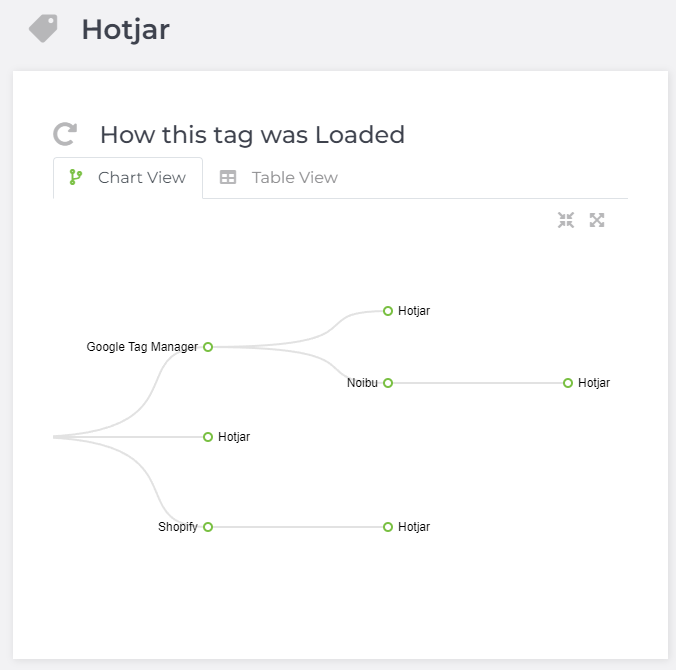
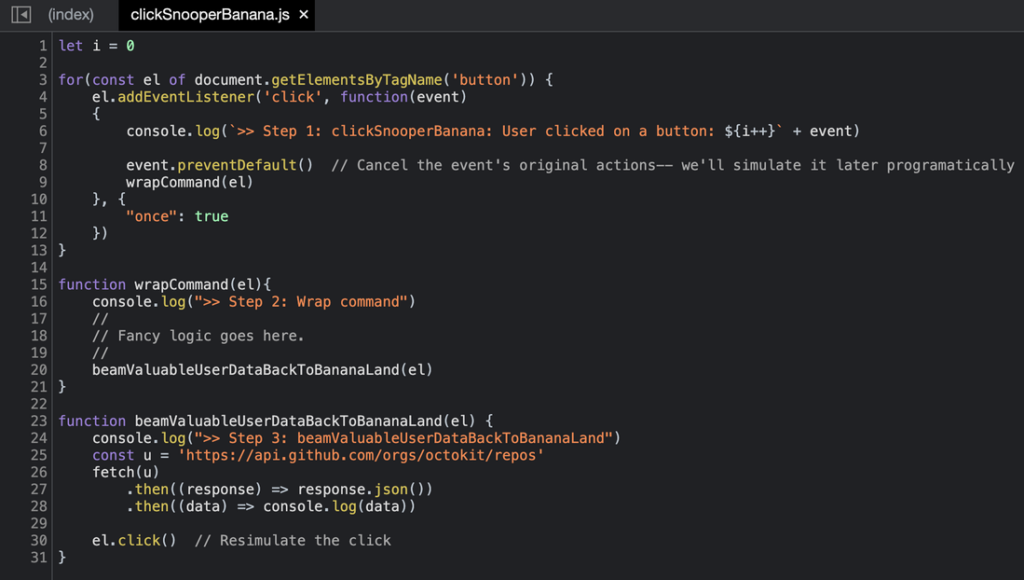
To celebrate this momentous occasion, over the next few weeks we are going to stroll through the hallowed halls of Tag Inspector history (#tag-inspector-decennial-series) and do technical deep dives into various aspects of the tool. Up for discussion today is the Tag Inspector Tag Stack Trace. One of the most useful features of the Tag Inspector tool, the Tag Inspector Tag Stack Trace shows you the load and call hierarchy of what tags are making what network requests, which are loading on your site. The one thing to always keep in mind is that whether first party or third party, direct or indirect, at the day’s end—you, the site owner—are solely responsible for all customer data that is leaving your site.

Why Use the Tag Stack Trace?

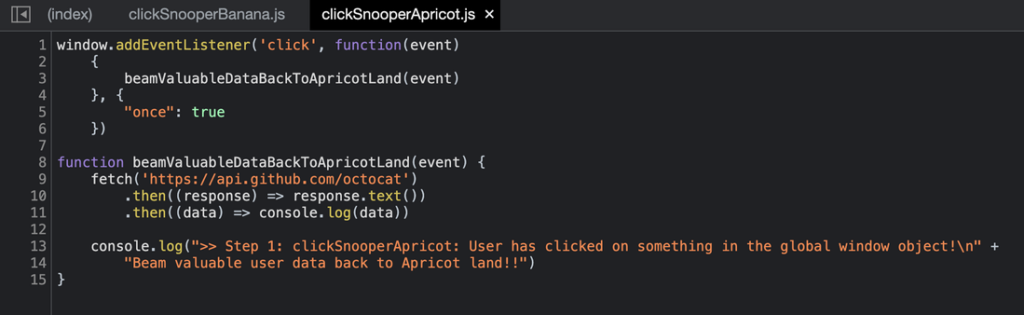
The world of piggybacking tags is rich and over the years, various tags have found all sorts of clever ways to vacuum valuable user data off of your website and then send that valuable harvested data to various third-party endpoints around the world. This has led to an advertising and audience retargeting ecosystem that is immensely valuable.

The first thing to understand about piggybacking tags is that at the highest level, there are two methods by which tags can “piggy back”. The first method is obvious and what we call an “Explicit Piggyback”—the most notable example of this is Tag Management Systems (TMS)—such as Google Tag Manager, Tealium, Adobe Launch—in which you explicitly define a piggybacked tag that you wish to load in via your TMS tag.

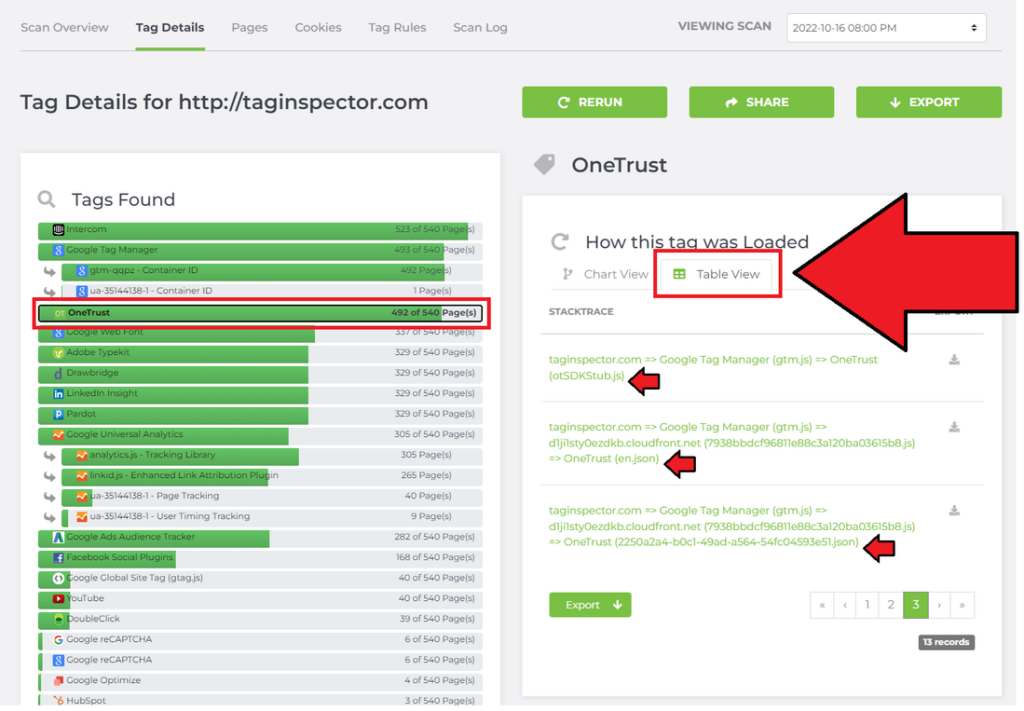
For the sake of demonstration, for method one, let’s look at the popular Consent Management Platform (CMP) tool, OneTrust. Let’s say you are interested in seeing how it loads on your site.

Method #1: Explicit Piggyback

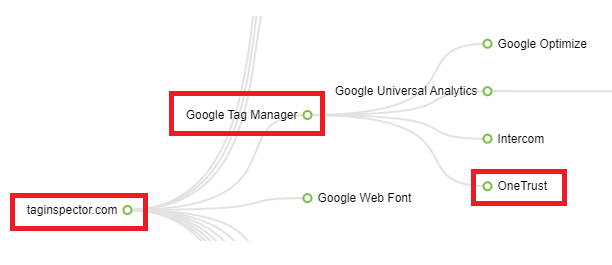
Anyone using Tag Inspector will be familiar with the tag hierarchy view which appears on the Scan Overview tab of the the Scanner module. From the the tag hierarchy view, you can easily see that OneTrust is loading from Source → Google Tag Manager → OneTrust:

But while this view is a good high-level overview, it lacks some of the technical details that your developers may need if they wished to see what specific JavaScript file or call was being loaded or made from Google Tag Manager. This is when one would use the Tag Stack Trace, which we give more granular technical details below.

Where to Find the Tag Stack Trace

The Tag Stack Trace can be found in two places in the Tag Inspector Scanner module:

The “Tag Details” Tab

To continue with the previous example, say you are curious about seeing the technical details of where “OneTrust” is being called or loaded from. The first place you could see OneTrust’s Tag Stack Trace is on the Tag Details tab under Table View tab. (Make sure you click on the tag name in the left pane.):

Here, you can more specifically see that after Google Tag Manager (gtm.js) loads, there are three OneTrust-related network requests being made for:

  • otSDKStub.js

  • en.json

  • 2250a2a4-b0c1-49ad-a564-54fc04593e51.json

Remember: With any network request, there is always the potential for customer data to be sent to the endpoint that is specified (OneTrust servers, in this example).

On the “Pages” Tab Down in the “Tag Requests” Pane

The second place to find the Tag Stack Trace is the “Pages” tab. To continue with the “OneTrust” example, click on the “Pages” tab and find the page you wish to examine. For the purposes of this example, we have been looking at the taginspector.com landing page (/) so we click on that specific page and then we expand the “OneTrust” tag in the “Tag Requests” pane. Here you will see the same information as we saw in the previous “Tag Details” pane:

Method #2: Intertwined Call Stack

While Method #1 is quite straightforward and intuitive to understand, there is a second method by which tags can hoover up valuable customer data to send back to various third-party endpoints.

To illustrate this example, let’s look at the popular tag, Hotjar.

For clients who use Hotjar, you will often see this kind of tag hierarchy map:

At first, you may be confused. Why does Hotjar load so many times? Sure, it loading through a TMS like Google Tag Manager makes sense, but according to Tag Inspector, Hotjar is also loading through:

  • Noibu

  • Source

  • Shopify

To understand why this is happening, if you view Hotjar’s site, you’ll see it’s one of these “Session replay capture” tags that is built to capture user behavior. It’s super-fancy and can give insights into mouse movement paths and heatmaps. With Hotjar, you can see exactly where users are waving around their mouse and exactly where they’re abandoning your site:

But at a technical level, have you ever wondered how tags such as Hotjar are able to monitor everything that’s going on, on your site?

While we won’t take time to specifically reverse-engineer Hotjar in this blog article, let’s next examine a far simpler toy example.

Toy Example That Shows an Intertwined Call Stack

Consider two tags that you load into your site:

  • clickSnooperBanana.js

  • clickSnooperApricot.js

As you can see, both tags are loaded in the global namespace and do not explicitly call each other:

clickSnooperBanana.js is a tag retrieves all buttons on a webpage and attaches a clickSnooper that will beam all button clicks (and whatever attendant valuable customer data) back to Banana Land.

Meanwhile, clickSnooperApricot.js is a tag that simply attaches a snooper function to all clicks and monitors any time a user clicks at all. Every time a user clicks anywhere on the page (a link, a button, an image, text, etc), that click (and any attendant valuable customer data) is beamed back to Apricot Land.

So what happens when a user clicks on Test Button? Well:

As you can see, as you may have expected, both tags’ functions made it into the call stack. Because at some point after the button click, function calls from clickSnooperBanana.js and clickSnooperApricot.js were both invoked! In this contrived example, both click snoopers were beaming valuable client data to their respective endpoints (Apricot Land and Banana Land).

Also, notably: Notice how in the Request initiator chain that only clickSnooperApricot.js appeared. Tag Inspector doesn’t only look at the Request initiator chain but instead also looks at the entire call stack. So in Tag Inspector, in this particular example, the tag stack trace would show the full picture:

  • SourceBanana SnooperApricot Snooper

In Closing

While this toy example was contrived and simple, hopefully it illustrates the true power of Tag Inspector and why the Tag Inspector tool is a valuable asset in any organization’s tag auditing and monitoring portfolio. And furthermore: Just because a tag may not be explicitly loading another tag, that doesn’t necessarily mean that they’re not intertwined!

Again, at the day’s end, no matter what third-party tags that data may be piggybacking out on: You are responsible for ALL customer data that leaves your site.

Do you have questions about the Tag Stack Trace?

Our team of experts has the answers!
Originally Published On October 28, 2022
October 28, 2022