Time is Money
You’ve probably heard the old adage, “Time is money,” and this is particularly true for e-commerce websites. An e-commerce website’s page load times have a direct effect on customer engagement and a business’ bottom line. E-commerce sites that load quickly have better engagement and conversion rates, and the numbers speak for themselves:
- The median load-time for top U.S. retail sites is 7.25 seconds, more than double the optimal 3 second time*
- If an e-commerce site is making $100,000 per day, a 1-second delay in the average site load time could potentially cost the site owner $2.5 million in annual lost sales*
- A one second delay in mobile page load time equals a 7% loss in conversion*
With greater online competition and customer’s lower attention spans, it is important that e-commerce sites load quickly to maximize user experience and increase conversions. Conducting a Page Timing Revenue Analysis can help determine your business’s page load to revenue.
Page Timing Revenue Analysis
The goal of Page Timing Revenue Analysis is to be able to make decisions about tags/vendors based on page load to revenue for your business. More specifically, this analysis will help to determine:
- How many tags are too many?
- How much does tag X impact page performance?
- What is the net cost of a tag?
- How is site performance overall?
One of the easiest ways you can begin to analyze this data is through standard Site Speed reports that are available in Google Analysis. These reports are located in the main left-side navigation under Behavior>Site Speed.
The report below was created using Behavior>Page Timings>Distribution Tab
and shows that for this particular site, the average page load time is 5.65 seconds and the majority of users visiting the site fall into the 1-3 second and 3-7 second page load time.
By default, the site sample for these reports is 1% but you can change the sample size percentage.

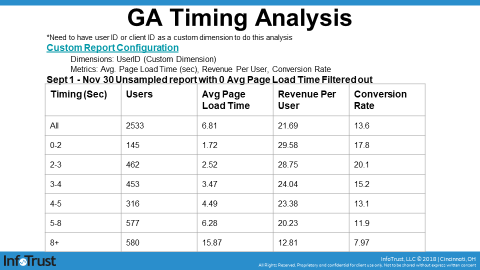
You can also customize Site Speed reports utilizing a number of dimensions. The report below compares Page Load Time in seconds with Revenue per User and Conversion Rate. Despite the outlier in the 2-3 second range, the longer page load time in seconds shows lower revenue per user and a lower conversion rate.

Tag Inspector Blocking Tag Analysis
Having confirmed that slower page load times are resulting in lower revenue and conversion rates, the next step would be to identify which tags are causing the slower load times. Using Tag Inspector Scan API to block specific tags, the scan can identify which tags have the highest impact on DOM Complete. For the example below:
- The scan was completed on 500 PDPs (Product Detail Pages)
- The scan identified that the biggest Impacts on DOM Complete are Namogoo (1.8sec) and Bloomreach (1.6sec)
- Both tags had the largest impact in Page Size change and Request count change
- It was determined that Neustar was only really affecting the first paint change. A solution for this particular tag could be to give it a lower tag firing priority.
- Certona, BazaarVoice, and Hero chat all affected DOM Complete by about 1.3 secs

Once the tags are identified they could be removed from the site, which would allow for a comparison between revenue and conversions before and after the tags were removed from the site.
The Bottom Line for Your Bottom Line
Time really is money, and customers don’t want to waste theirs waiting for your site to load. With so many online shopping options for consumers, they won’t wait long for pages to load before moving on to a competitor’s site. Utilizing Tag Inspector Scan API to determine which tags are causing slower load times will help improve the decisions made about tags and vendors based on page load to revenue. Even a one-second improvement in page load times can increase yearly revenue by millions of dollars by providing customers with a better user experience.
*How much is each second worth in ecommerce?
To learn more about Tag Inspector API and block scans, contact your Tag Inspector Consultant today.
